在 Excel 中快速建立堆疊變異直條圖或條形圖
Kutools for Excel
透過 300+ 強化 Excel
強大功能
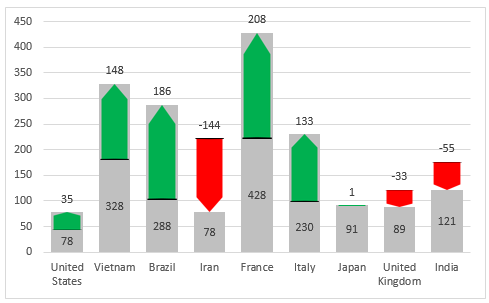
本文將介紹一種能清晰呈現兩組資料變動趨勢的圖表,如下方截圖所示:圖中向上的綠色箭頭代表成長,向下的紅色箭頭則代表下降。若要快速建立此類圖表,只需使用 Kutools for Excel 的差值堆疊圖功能,即可依需求輕鬆打造堆疊變異直條圖或條形圖!

在 Excel 中快速建立堆疊變異直條圖或條形圖
安裝 Kutools for Excel 後,請依照下列步驟操作:
1. 點擊 Kutools> 圖表> 差異對比> 差值堆疊圖,請參閱截圖:

2. 在差值堆疊圖對話方塊中,請執行下列操作:
(1.)選取您要建立的儀表類型,可依需求選擇柱狀圖或條形圖;
(2.)從圖表顏色下拉清單中指定圖表色彩;
(3.)請分別從選擇數據區段中選取軸標籤、第一筆資料系列與第二筆資料系列。

3. 完成設定後,請按一下確定按鈕,即可獲得如下方截圖所示的堆疊變異直條圖或長條圖:
堆疊變異柱狀圖 | 堆疊變異條形圖 |
 |  |
注意事項:
1. 當您使用此功能建立差值堆疊圖時,系統將彈出提示方塊,提醒您同時會建立一個名為 Kutools_Chart 的隱藏工作表,用以儲存中繼資料。請勿刪除此隱藏工作表,否則圖表將無法正確顯示!

2. 在差值堆疊圖對話方塊中點擊範例按鈕,即可利用範例資料與範例差值堆疊圖產生新工作簿。
推薦的生產力工具
Office Tab:在 Microsoft Office 中使用實用的分頁標籤,就像 Chrome、Firefox 與新版 Edge 瀏覽器一樣!透過分頁輕鬆切換文件,告別雜亂視窗。了解更多……
Kutools for Outlook:Kutools for Outlook 提供 100 多種強大功能,全面支援 Microsoft Outlook 2010–2024(及後續版本)與 Microsoft 365,助您輕鬆簡化郵件管理、大幅提升工作效率!了解更多……
Kutools for Excel
Kutools for Excel 提供 300 多項進階功能,助您在 Excel 2010 至 2024 及 Microsoft 365 中大幅提升工作效率。上述功能僅為眾多省時利器之一。
