跳到主要內容

如何計算Excel列中的重複值?

如果您在工作表中有一個包含唯一值和重複值的數據列表,並且您不僅想計算重複值的頻率,還想知道重複值的出現順序。 在Excel中,COUNTIF函數可以幫助您計算重複值。


計算Excel中重複項的頻率

在Excel中,您可以使用COUNTIF函數來計算重複項。

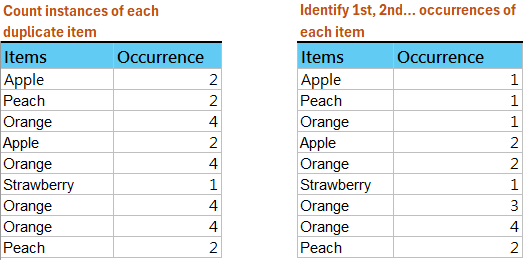
選擇一個與列表中第一個數據相鄰的空白單元格,然後鍵入此公式 = COUNTIF($ A $ 2:$ A $ 9,A2) (範圍 $ A $ 2:$ A $ 9 指示數據列表,並且 A2 站立要計數頻率的單元格,可以根據需要更改它們),然後按 Enter,然後拖動填充手柄以填充所需的列。 看截圖:

尖端:如果要計算整個列中的重複項,請使用此公式 = COUNTIF(A:A,A2) (“ A欄 指示數據列,並且 A2 代表您要計數頻率的單元格,您可以根據需要更改它們)。

快速從Excel中的列中選擇併計算所有重複/唯一值

通常,我們可以輕鬆地從列表中刪除重複項 數據 > 刪除重複項 在Excel中。 但是,如何選擇重複/唯一值,或從一列中計算它們呢? 如果選擇或計算除第一個重複項外的重複項/唯一性,該怎麼辦? 嘗試Kutools for Excel的 選擇重複和唯一單元格 效用!


廣告選擇計數重複

Excel的Kutools - 使用 300 多種基本工具增強 Excel 功能。 享受全功能 30 天免費試用,無需信用卡! 立即行動吧!

計算Excel中重複項的出現順序

但是,如果要計算重複項的發生順序,則可以使用以下公式。

選擇一個與列表中第一個數據相鄰的空白單元格,然後鍵入此公式 = COUNTIF($ A $ 2:$ A2,A2) (範圍 $ A $ 2:$ A2 指示數據列表,並且 A2 站立您要計算訂單的單元格,您可以根據需要更改它們),然後按 Enter,然後拖動填充手柄以填充所需的列。 看截圖:


使用Kutools for Excel計算並選擇列中的所有重複項

有時,您可能希望計算並選擇指定列中的所有重複項。 您可以使用Kutools for Excel輕鬆完成它 選擇重複項和唯一單元格 效用。

Excel的Kutools - 包含 300 多個 Excel 基本工具。 享受全功能 30 天免費試用,無需信用卡! 現在下載!

1。 選擇要計算所有重複項的列或列表,然後單擊 庫工具 > 選擇 > 選擇重複項和唯一單元格.

2。 在打開的“選擇重複和唯一單元格”對話框中,選中 重複(第一個除外) 選項或 全部重複(包括第一個) 選項,然後單擊 Ok 按鈕。

然後您將看到一個對話框,顯示選擇了多少重複項,同時在指定列中選擇了重複項。

注意: 如果您要計算包括第一個在內的所有重複項,則需要檢查 全部重複(包括第一個) 選擇重複和唯一單元格對話框中的選項。

3。 點擊 OK 按鈕。

Excel的Kutools - 使用 300 多種基本工具增強 Excel 功能。 享受全功能 30 天免費試用,無需信用卡! 立即行動吧!


使用Kutools for Excel計算一列中每個重複項的出現

Kutools for Excel的 高級合併行 實用程序可以幫助Excel用戶批量計算一列(在本例中為“水果”列)中每個項目的出現,然後輕鬆刪除基於該列(“水果”列)的重複行,如下所示:

Excel的Kutools - 包含 300 多個 Excel 基本工具。 享受全功能 30 天免費試用,無需信用卡! 現在下載!

1。 選擇包含要計算每個重複項的列的表,然後單擊 庫工具 > 內容 > 高級合併行.

2。 在“高級合併行”中,選擇要計算每個重複項的列,然後單擊 首要的關鍵,接下來選擇要在其中計算結果的列,然後單擊 計算 > 計數,然後單擊 OK 按鈕。 看截圖:

現在,它已計算出指定列中每個重複項的出現。 看截圖:

Excel的Kutools - 使用 300 多種基本工具增強 Excel 功能。 享受全功能 30 天免費試用,無需信用卡! 立即行動吧!


演示:Kutools for Excel在Excel中的一列中計算重複值


Excel的Kutools:超過 300 個方便的工具觸手可及! 立即開始 30 天免費試用,沒有任何功能限制。 現在就下載!

相關文章:

最佳辦公生產力工具

🤖 Kutools 人工智慧助手:基於以下內容徹底改變數據分析: 智慧執行   |  生成代碼  |  建立自訂公式  |  分析數據並產生圖表  |  呼叫 Kutools 函數...
熱門特色: 尋找、突出顯示或識別重複項   |  刪除空白行   |  合併列或儲存格而不遺失數據   |   沒有公式的回合 ...
超級查詢: 多條件VLookup    多值VLookup  |   跨多個工作表的 VLookup   |   模糊查詢 ....
高級下拉列表: 快速建立下拉列表   |  依賴下拉列表   |  多選下拉列表 ....
欄目經理: 新增特定數量的列  |  移動列  |  切換隱藏列的可見性狀態  |  比較範圍和列 ...
特色功能: 網格焦點   |  設計圖   |   大方程式酒吧    工作簿和工作表管理器   |  資源庫 (自動文字)   |  日期選擇器   |  合併工作表   |  加密/解密單元格    按清單發送電子郵件   |  超級濾鏡   |   特殊過濾器 (過濾粗體/斜體/刪除線...)...
前 15 個工具集12 文本 工具 (添加文本, 刪除字符,...)   |   50+ 圖表 類型 (甘特圖,...)   |   40+ 實用 公式 (根據生日計算年齡,...)   |   19 插入 工具 (插入二維碼, 從路徑插入圖片,...)   |   12 轉化 工具 (數字到單詞, 貨幣兌換,...)   |   7 合併與拆分 工具 (高級合併行, 分裂細胞,...)   |   ... 和更多

使用 Kutools for Excel 增強您的 Excel 技能,體驗前所未有的效率。 Kutools for Excel 提供了 300 多種進階功能來提高生產力並節省時間。  點擊此處獲取您最需要的功能...

產品描述


Office選項卡為Office帶來了選項卡式界面,使您的工作更加輕鬆

  • 在Word,Excel,PowerPoint中啟用選項卡式編輯和閱讀,發布者,Access,Visio和Project。
  • 在同一窗口的新選項卡中而不是在新窗口中打開並創建多個文檔。
  • 將您的工作效率提高 50%,每天為您減少數百次鼠標點擊!
Comments (58)
No ratings yet. Be the first to rate!
This comment was minimized by the moderator on the site
Tolong di Bantu, Jika misalkan di Kolom A Misalkan No Part yang sama ada 3 Part, lalu di kolom b ada tiga progress, Bagaimana menegtahui bahwa jika di kolom sudah complete semua maka di kolom c complete, tetapi jika ada salah satu belum complete maka di kolom C On Progress, Sebagai catatan untuk di kolom A variatif , ada yang jumlahnya 3, 4, 2, etc.. Mohon di bantu caranya untuk di excel.

A B C
Part 1 Progress On Progress
Part 1 Complete On Progress
This comment was minimized by the moderator on the site
Halo, bagaimana jika kita ingin menjumlahkan total dari data duplikat tersebut? Contoh, Banyaknya Apel pada baris satu adalah 734pcs, Apel pada baris 5 100pcs, Apel pada baris 8 20pcs. Bagaimana cara menjumlahkannya dengan otomatis? Terima Kasih untuk jawabannya
This comment was minimized by the moderator on the site
Hi Lia,
You can wrap multiple COUNTIF expressions into one SUM formula, in which the COUNTIF expressions shoule be seperated by comma. Here is an example: =SUM(COUNTIF($B$2:$B$8, B2),COUNTIF($B$2:$B$8, B3),COUNTIF($B$2:$B$8, B4)).The cells B2, B3, B4 stand for the value that you want to count its frequency.
Hope this helps you.
Amanda
This comment was minimized by the moderator on the site
Hi, I'm trying to calculate the duplicate values as a single value in excel. But I can't. Can you help me?. For example, I have entered in rows as 1001,1002,1003,1004 and again 1001,1002,1003,1004" like this. In this case, all are duplicate ones. but it should bring "1001" as a single count, not two counts. Is there any formula for it?
This comment was minimized by the moderator on the site
Hi Manikandan.K,
Supposing the data you will count are placed in the Range A1:A20, you can use below arrow formula to count (a set of duplicates only count once):
=SUM(IF(A1:A20<>"",1/COUNTIF(A1:A20,A1:A20)))
Please note that it’s an array formula, please press Ctrl + Shift + Enter keys to get the counting result.
This comment was minimized by the moderator on the site
Hi can you please let me know in this how to calculate data in multiple conditions include wiht this condition,  if I also chosen columns in location wise and status wise Thank you 
This comment was minimized by the moderator on the site
Hi I'm trying to run the "Advanced Combined Row" feature, but when I run it excel crashes every time.
This comment was minimized by the moderator on the site
I have entered in a row as " 10,10,10,10,10,10,10,8,11,10,10,10,10,10" like this, now I entered 14 number values. How I can count the different number in single row? the result should be "14" in my case.
This comment was minimized by the moderator on the site
Hi Sampath Rangan,
Do you need to count all numbers in the row, or count the duplicates in the row?
Supposing the numbers are in the Range A1:N1, now you can count the numbers as follows:
Count all numbers: =COUNT(A1:N1)
Count duplicates, says 10: =COUNTIF($A$1:$N$1,"10")
This comment was minimized by the moderator on the site
Thanks so much, saved me hours!
This comment was minimized by the moderator on the site
i need this
There are 24 students.how many groups are there to take 10 student in 1 group
example:
1,2,3,4,5 take 1 group in 3 number

ans={1,2,3} {2,3,4} {3,4,5} {4,5,1} {5,1,2,}

how to do this excel will create this file
This comment was minimized by the moderator on the site
Hi patel akshay,
You can use the COMBIN function in Excel directly.
=COMBIN(24,10)
This comment was minimized by the moderator on the site
Thank You very much. It's very useful.
This comment was minimized by the moderator on the site
I must be stupid as the KuTools solution is not working for me. I have copied the example with Fruits column (which I put 3 Apple entries in), made a column next to it which is blank called Count column. KuTools -> Content -> Advanced Combine Rows. Select Fruit column as primary key, Count column as Calculate -> Count. Hit OK. Nothing. No change to the sheet. Help please?
This comment was minimized by the moderator on the site
Hi BillBrewster,
Would you do me a favor and send me a screenshot about the Advanced Combine Rows dialog? Just like the screenshot as below. Thanks in advance!
This comment was minimized by the moderator on the site
Dear, I am working on the attached Screenshot and Excel File. I need to calculate the Values in Column "G" i.e. to Count unique text values based on multiple (Two) criteria, but criteria are in NUMBERS. Further, Its is big sheet, therefore I want to use the cell reference in range and in criteria. I am very confused. I want to count the column C i.e. Degree based on the Criteria E and F. That is,I need to set formula in G2, such that, Look E2 in column A and Look F2 in column B and count the unique text values in Column C. Hope it is clear.

I am very thankful to you please


Details:
I have a data of more than 1000 companies with different year. As in column A, I have companies and B shows the year for which these companies have data. For example, First company have data for year 2011, 2012, 2013 and 2015. For company 2, I have data for year 2014 and 2011 and so on. Since majority of companies have data from 2011 to 2015, therefore I select this range in column F for each company. Now, I want to count the unique Degrees for cell G2, if there is 389841988 (Company ID for First company) in A and there is 2011 in Column B. Now I need to set formula in G2,in a way, If I will drag the formula G2 in cell G3, then It should give me the value by looking such as if there is 389841988 (Company ID for First company) in A and there is 2012 in Column B, the based on these two criteria, it should count the unique text in C2 and so on.
Look on the second sheet named Example, I did the same for INDEX, MATCH function and as well for SUMIFS function; in C2 I have the array formula INDEX($F:$H,MATCH(1,(A2=$F:$F)*(B2=$G:$G),0),3) and in D2 I have SUMIFS(I:I,F:F,A2,G:G,B2). These help me to do what I want with two criteria (To match and also to sum) and also I can drag these for rest of cell. I am looking something like this, or anything that I can drag to count unique degrees. Thank you very much. I am waiting.

Plz help. I am very thankful to for this kindness
There are no comments posted here yet
Load More
Please leave your comments in English
Posting as Guest
×
Rate this post:
0   Characters
Suggested Locations